National Grid has now published the dates and times for the winter 2015/16 Triads. These are the three half hourly periods when demand was at its highest. For most businesses with pass-through transmission network charges (TNUoS), the volume consumed during these three peak half-hourly periods will determine how much their TNUoS bill will be.
The Triad periods for winter 2015/16 are:
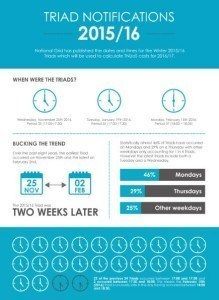
– Wednesday 25 November 2015, Period 35 (17:00-17:30)
– Tuesday 19 January 2016, Period 35 (17:00-17:30)
– Monday 15 February 2016, Period 37 (18:00 – 18:30)
Whilst the Triads in January and February were widely predicted due to the weather, the November Triad was unexpected and the majority of Triad prediction services did not issue a warning for this date. Triad predictions involve analysing weather patterns and demand forecasting – as the energy market becomes more dynamic and weather more unpredictable, Triad predictions could become more complex in future. This winter’s Triads were certainly unusual in more ways than one: Inenco’s analysts have looked at the past eight years of Triad data to look at how this winter compares with previous years.
Since winter 2007/08, the earliest Triad occurred on November 25 and the latest was on February 2. However last winter, we matched the earliest date, but extended the third Triad into the second half of February, almost two weeks later than normal.
Statistically, almost 46% of Triads have occurred on Mondays and 29% on Thursday, with other weekdays only accounting for one in four Triads. However, the latest Triads include both a Tuesday and a Wednesday.
Finally, the time of day that Triads occurred is also unusual. In the previous 24 Triads, 22 occurred between 17:00 and 17:30 and 2 occurred between 17:30 and 18:00. This means the February 15 Triad is unusually late in the day, having occurred between 18:00 and 18:30.
Explaining the anomalies
There are some good reasons for some of the anomalies in this year’s data. The key one is the weather: peak demand almost always correlates with colder temperatures, but winter 2015/16 started unusually mild and most places in the UK did not see temperatures approach zero until mid January and then again in the second half of February. These low ambient temperatures probably explain the second and third Triads.
Wind speeds also impact Triads. Remembering that Triads focus on the strain put on the national transmission network, during windy weather, onshore wind turbines embedded within regional distribution networks will significantly offset imports from the national transmission network – this is seen as a reduction in demand by National Grid. This effect does not apply to the offshore and very large onshore wind farms, which are typically connected directly to the national transmission network. All three of the 2015/16 Triads occurred on dates when wind speeds were below average, particularly on 19th January when winds speeds in many parts of the country were below the minimum threshold for wind turbines to operate. This date had the highest Transmission Network demand – almost 3GW higher than the other Triads periods!
The final factor that may be influencing Triads is Demand-Side Management. More and more electricity consumers are learning the benefits of reducing demand by switching off loads or starting stand-by generators during Triad warnings in an attempt to reduce the Triad charges. It may not be chance that caused the first Triad to be unexpected – it may be that the lack of a Triad warning was the reason that a Triad occurred, because few businesses reduced their demand!
In the future, we expect to see more businesses participate in demand-side management. Shifting load away from peak demand periods not only avoids Triad costs, but also reduces distribution network (DUoS) charges and will also minimise Capacity Market costs in coming years. This will inevitably cause system demands to reduce between 16:00 and 19:00 on winter weekdays and could make Triads less and less predictable in the future.
How do I know what my TNUoS costs are?
Triads only directly impact businesses with pass through TNUoS costs: the amount they pay is directly determined by the average volume they consumed during the three half hourly Triad periods. Most Suppliers estimate a customer’s demand and spread the TNUoS charge over 12 months, then in April the actual charge is calculated and reconciled via a billing surcharge or rebate.
If you want to know more about how your business can take advantage of demand side management opportunities and be prepared for next winter, contact an Inenco expert on idm@inenco.com
To View our Triad infographic, click on the icon below:
David Oliver, Non-Commodity Charges Expert at Inenco Group
Site links


Sustainable Energy First, has acquired Inenco.